Understanding Drivers’ Decisionsto Improve Accessibility Ride Acceptance
A mixed-method UX research project exploring how drivers perceive wheelchair-ride requests, and how to improve acceptance rates for passengers with disabilities.
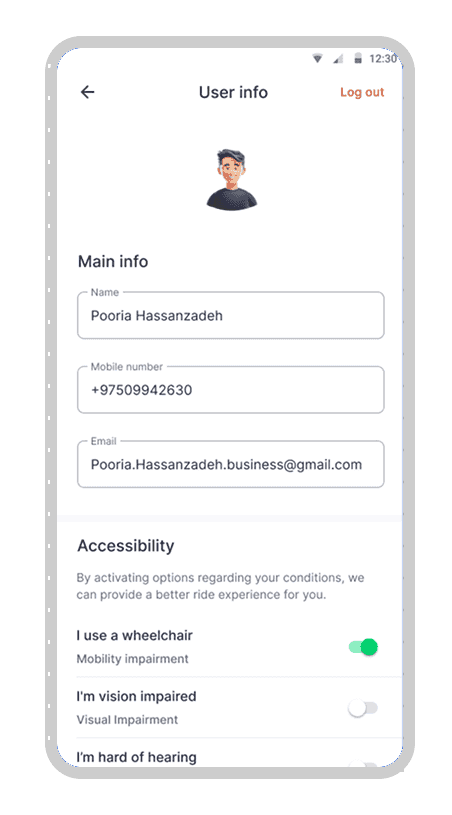
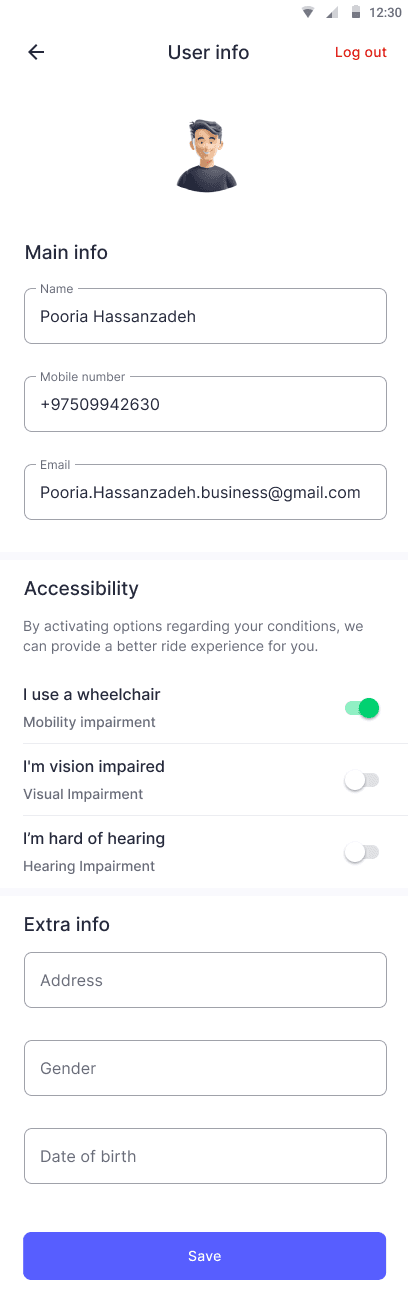
personal setting on passenger app.
Snapp
Snapp introduced an accessibility toggle for passengers with disabilities (wheelchair users, hearing-impaired riders, etc.). Drivers see a badge on the ride request, and these trips are commission-free to encourage participation.
but drivers cancel rides with wheelchair badge at higher rates:
- 15% cancel after accepting the request (vs. 6% for normal rides)
- 3% cancel after reaching pick-up (vs. 2% for normal rides)

driver offer page with a wheelchair badge.
Problem:
Lower acceptance hurts both brand reputation and ride completion rates, despite incentives.
so the company wants to know:
Why do drivers hesitate or reject ride with wheelchair?
how can we redesign the experience to improve acceptance and passenger satisfaction?
Research Questions:
Why do drivers reject or cancel accessibility rides?
- What challenges do wheelchair passengers face during trip requests?
- How might we improve the matching, communication, and experience for both parties?
Goal
Increase acceptance rates and satisfaction scores for wheelchair users on Snapp.


My Role & Team:
I led this project as the sole UX Researcher, collaborating closely with:
- Product Manager
- UX Writer
- Product Designer
- PR & CSR Specialists
I was responsible for planning, executing, analyzing, and presenting research, driving evidence-based product changes.
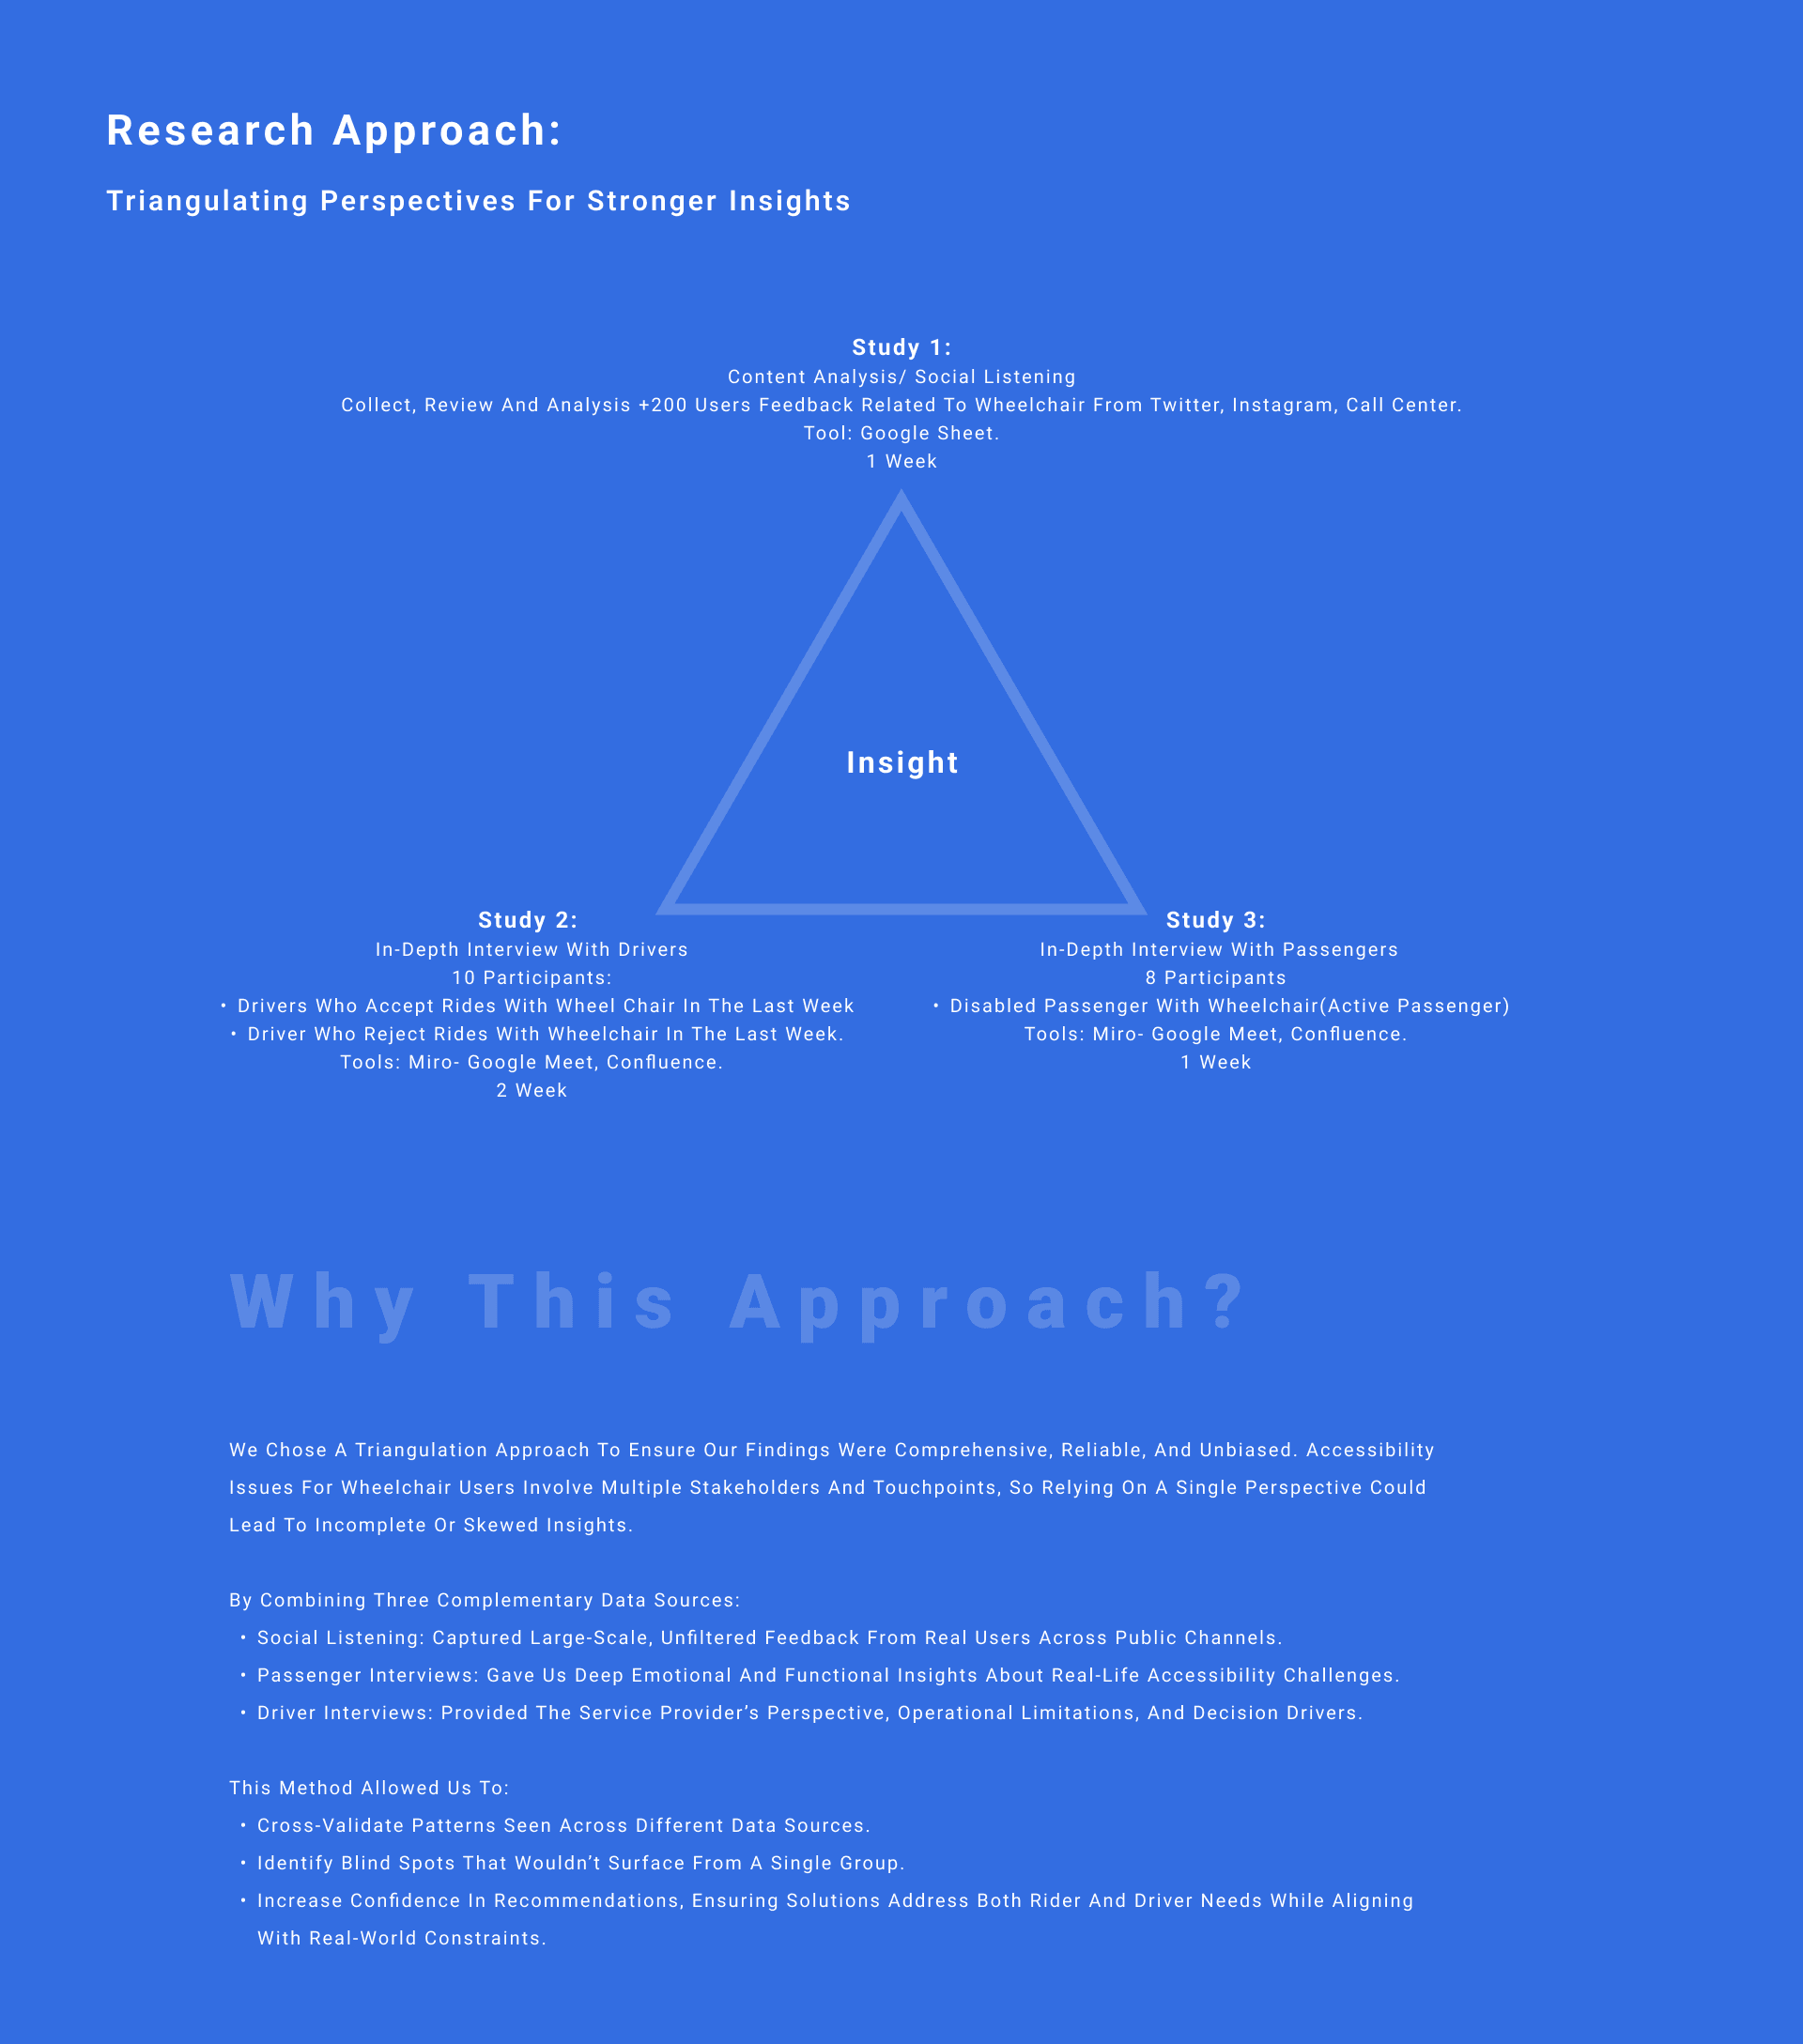
Content Analysis:

Raw data-content analysis

analyzed chart-content analysis
Top 5 reported issues:
No reliable filter or selection for wheelchair vehicles (24%)
- Driver cancellations after seeing a wheelchair (23%)
- Cars without enough space or ramp (22%)
- Poor support and unclear solutions (14%)
- Lack of trained or prepared drivers (9%)
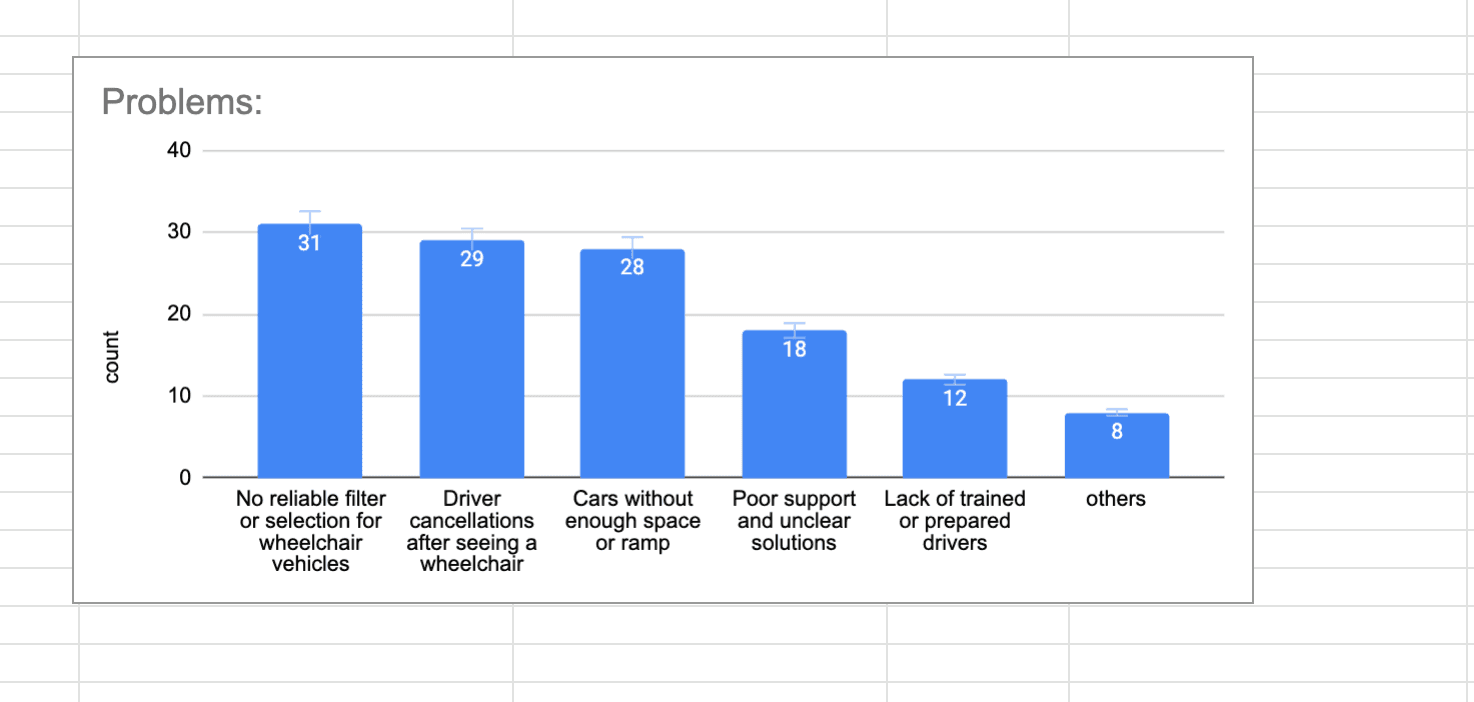
Top reported issues

these data helped us to be more familiar with users problems and let us to create better question to dig dive into root problems.
Passenger quote:
“I always need a family member at pickup or drop-off because most drivers can’t help me. I feel worried every time I have to ask them for assistance.”
Interview with Passengers.:
Key Findings:
Emotional Impact: Feelings of exclusion and frustration lead to switching apps or traditional taxis.
- Money Consuming: Passengers sometimes offer drivers up to 2x the fare to avoid being rejected.
- Physical Effort & Cultural Barriers: Difficulty transferring to car seats; some drivers or passengers feel uncomfortable due to cultural/religious norms around physical assistance.
- Unreliable Arrival Times: Longer wait times when drivers hesitate or cancel last-minute after realizing accessibility needs.
- Safety Concerns During Boarding: Fear of injury due to lack of ramps, proper securing, or trained assistance.
- Hospital Trip Rejections: A large number of ride requests to hospitals are declined by drivers, who worry about the passenger’s condition or potential liability.

Interview with Drivers.

Raw data-content analysis
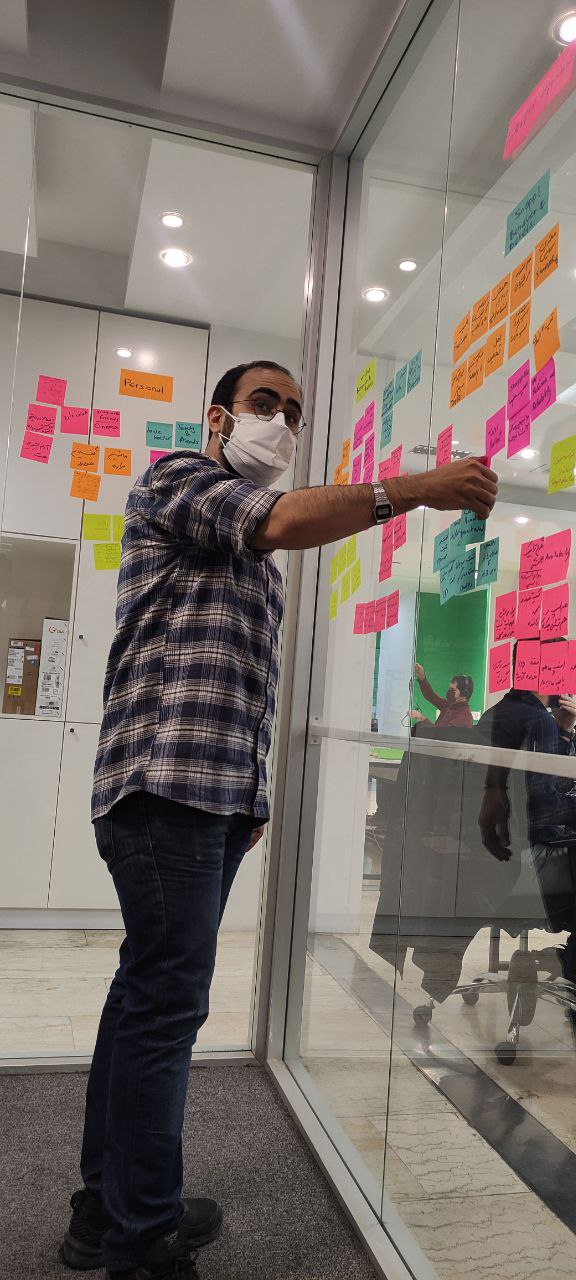
Figure 4:analysis interviews findings with the team (UXDesigners, UXWriter, Product manager)
Keyfindings:
Limited Vehicle Space: Many sedans can’t fit larger or non-foldable wheelchairs.
- Cleanliness Concerns: Drivers fear wheelchairs may dirty or damage their cars, affecting future rides and ratings.
- Physical Assistance Barriers: Some drivers are unable or unwilling to help passengers board due to health, cultural, or personal reasons.
- Extra Time Needed: Onboarding/offboarding takes longer, reducing earnings per hour.
- Difficult Pickups: Poor sidewalks, lack of ramps, or crowded streets make safe boarding challenging.
- Lack of Ride Details: Drivers often don’t know wheelchair needs in advance, causing awkward last-minute cancellations.
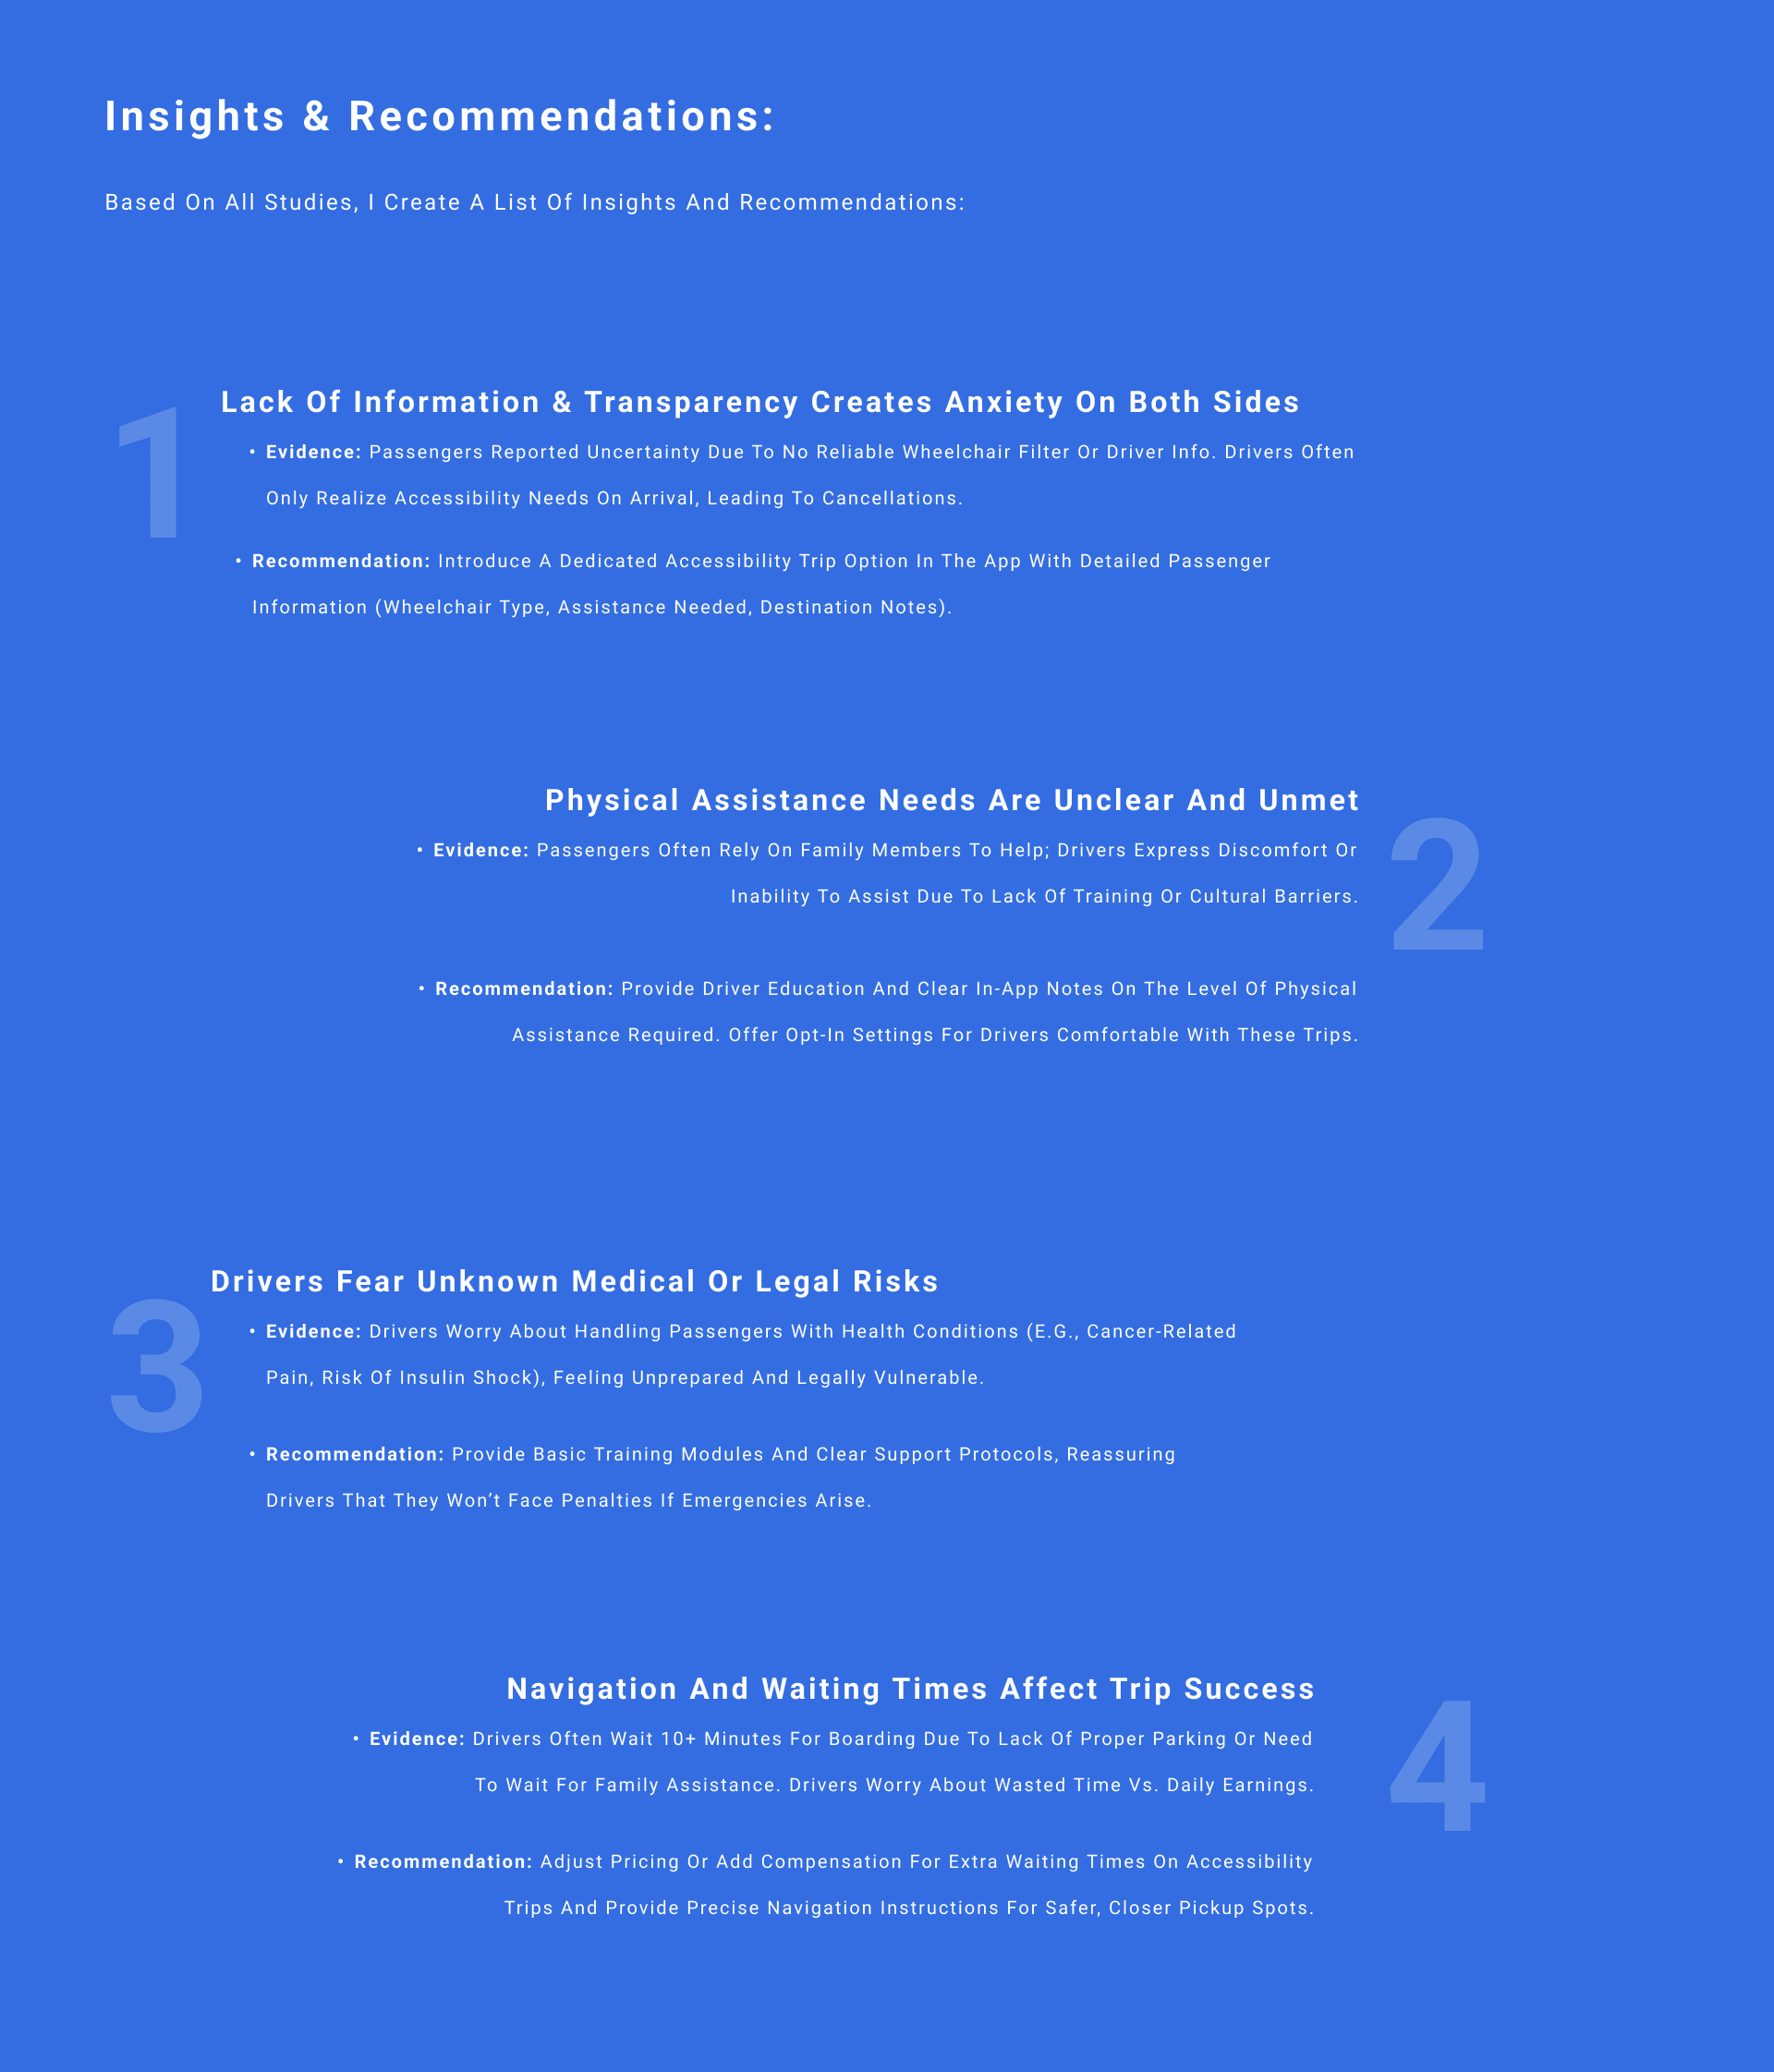
Impact
Based on our research findings, Snapp implemented several product and operational improvements to increase accessibility ride acceptance:
Updated the ride-matching algorithm to prioritize drivers with sufficient vehicle capacity.
- Added a fare badge highlighting higher compensation for accessibility rides.
- Introduced a driver onboarding screen with guidelines on communicating with passengers with different accessibility needs.
- Offered priority expensive offers to drivers who had successfully completed previous accessibility trips.
- Included detailed ride information (wheelchair type, passenger gender, whether accompanied or alone) to help drivers make informed decisions.

onboarding page for deaf passengers

onboarding page for blind passengers.

onboarding page for passenger with wheelchair

Ride offer with accessibility badges.
by applying these tips, acceptance rate of these rides increased for 13% and offer rejection by driver backed to normal rides.
Thanks For Reading.
Pooria Hassanzadeh
2023